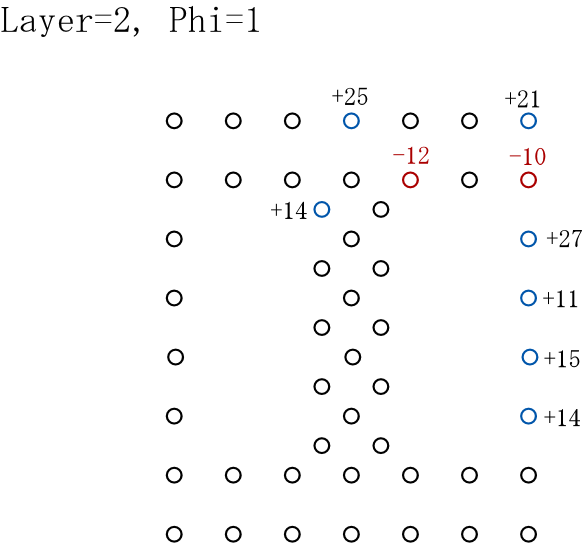
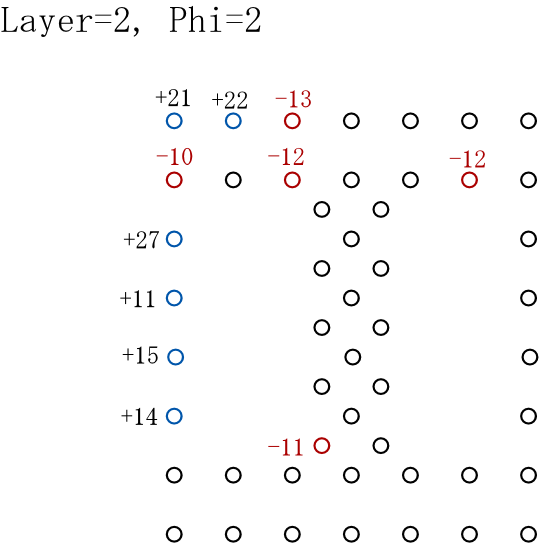
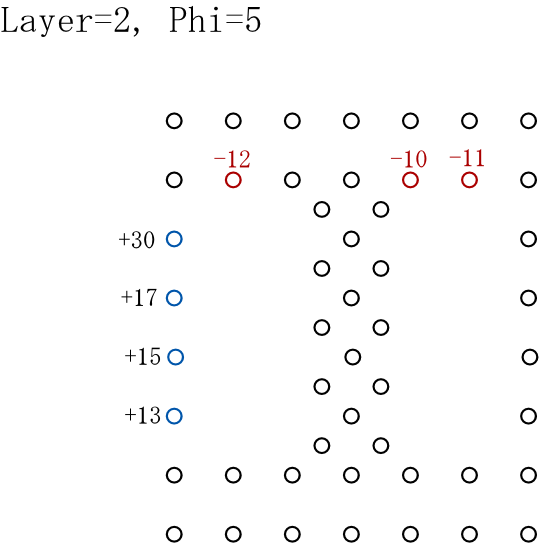
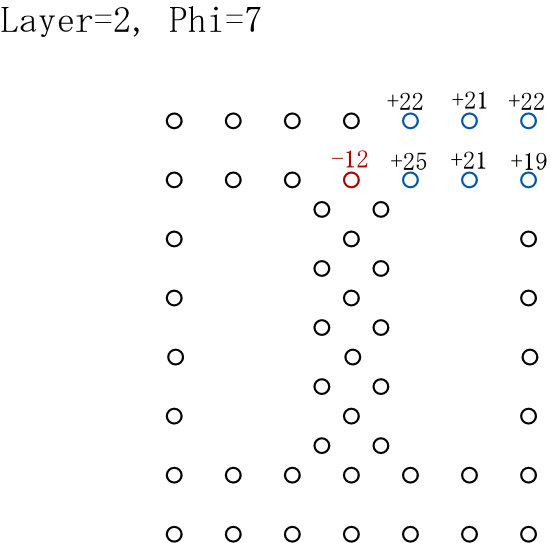
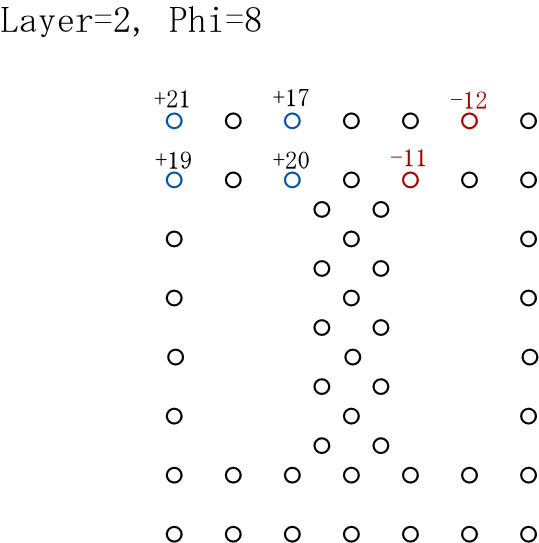
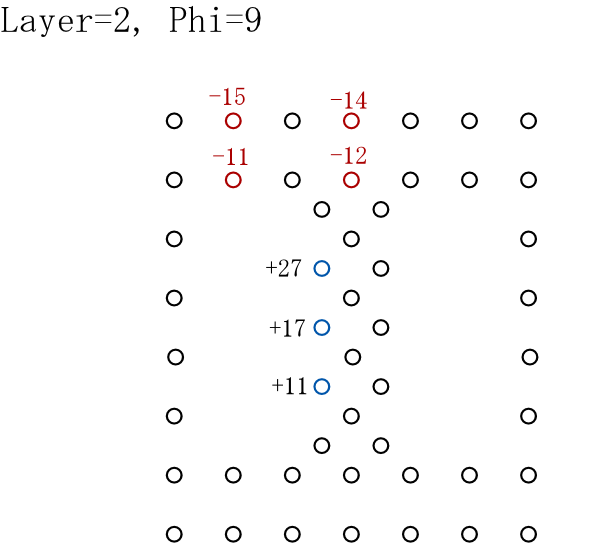
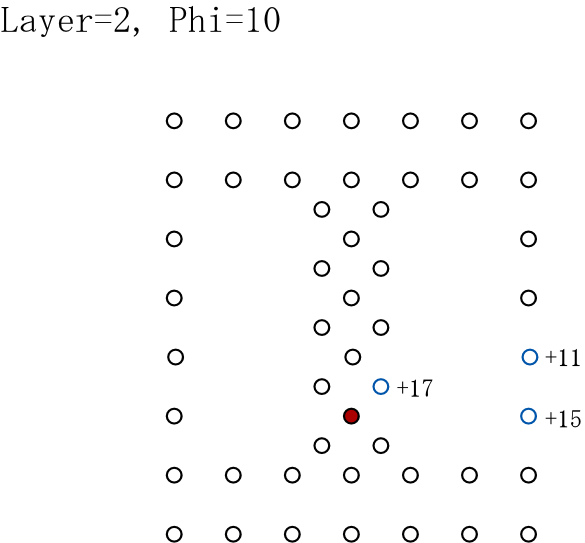
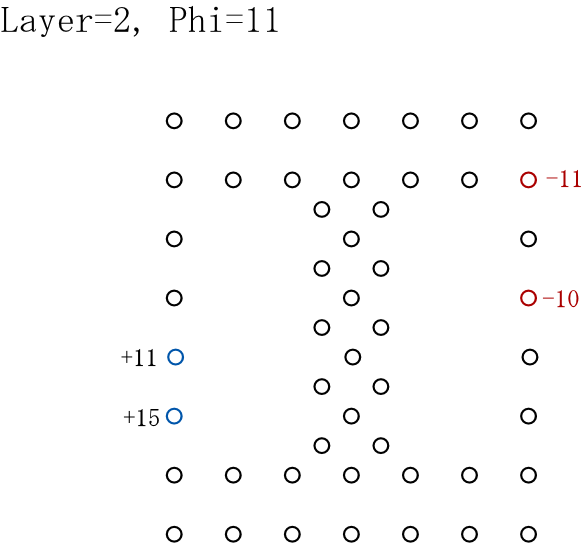
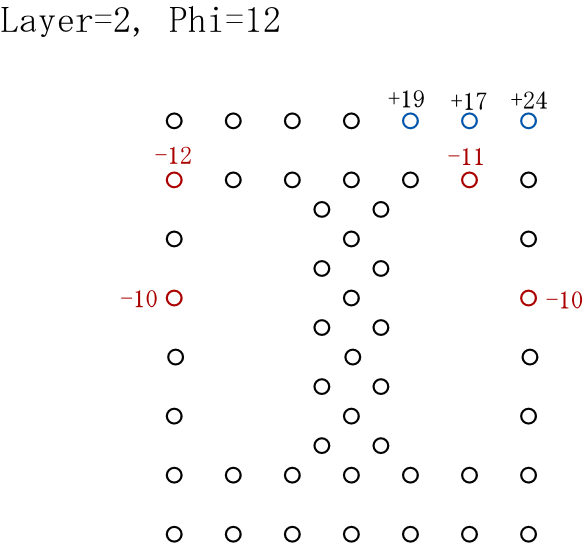
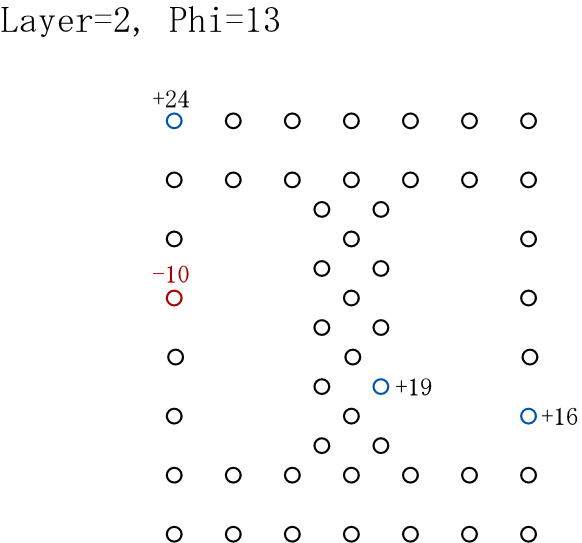
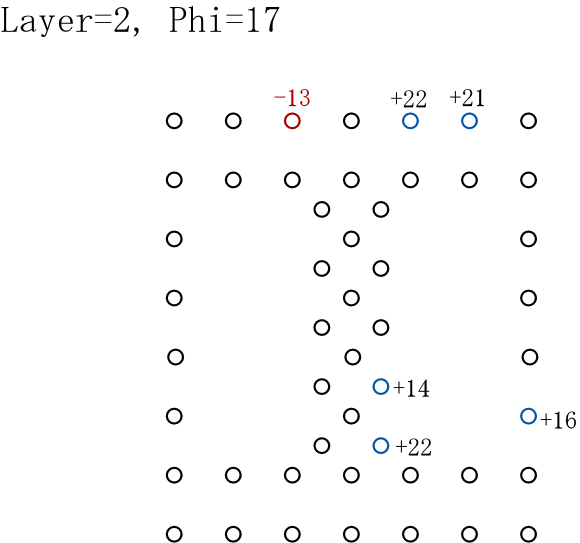
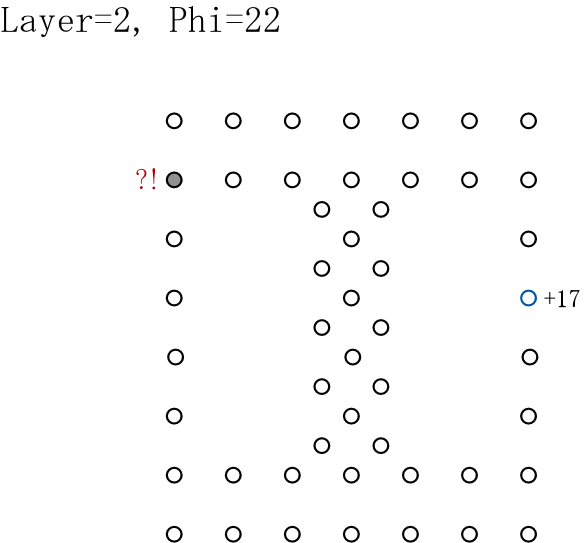
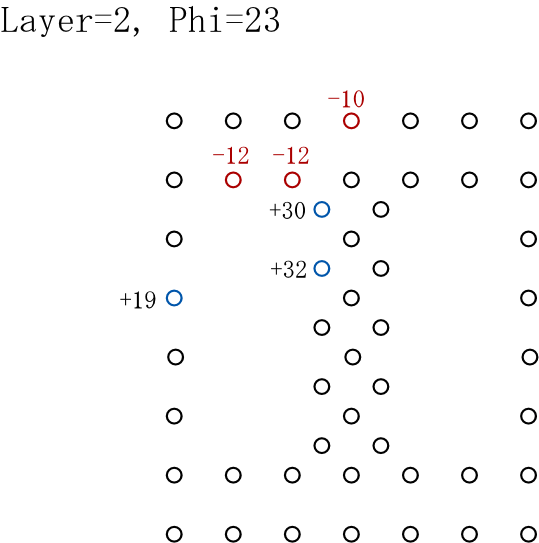
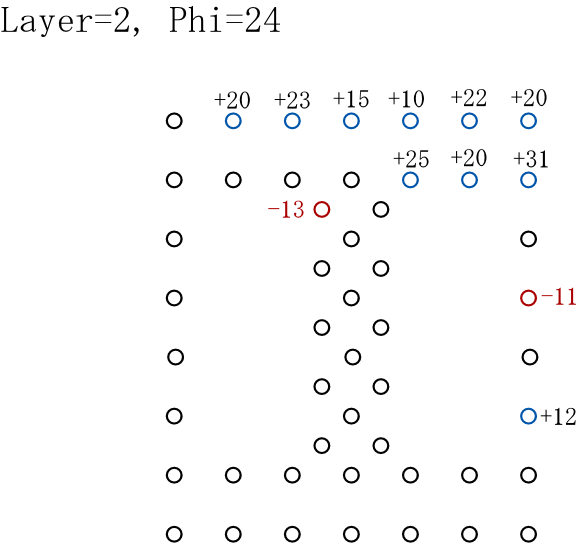
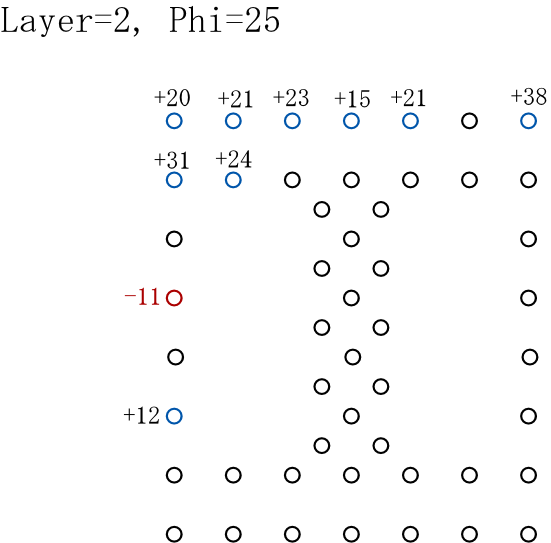
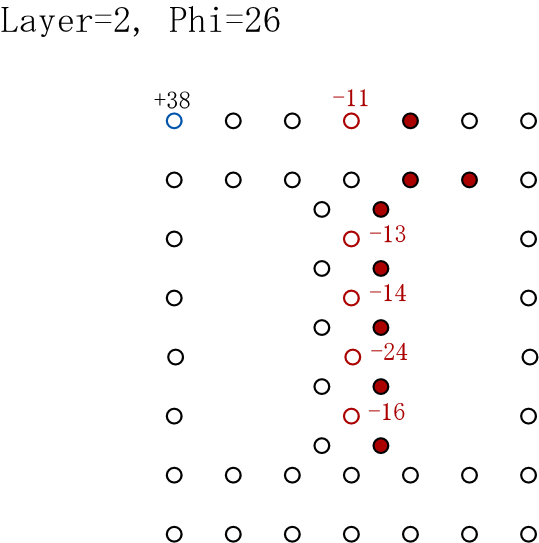
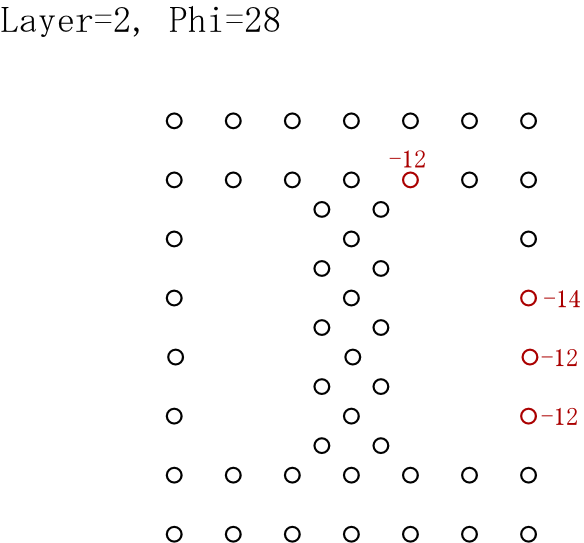
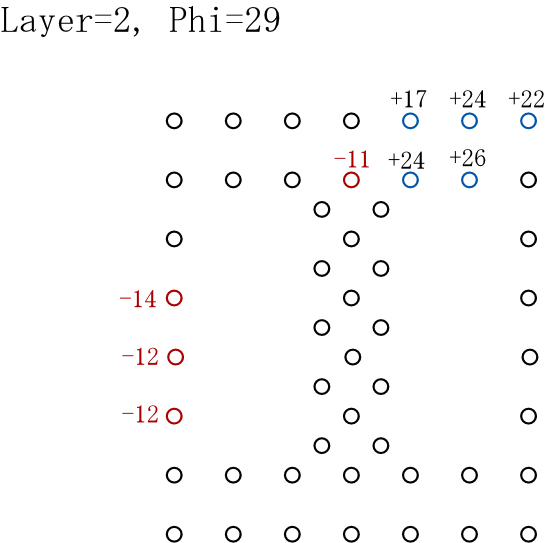
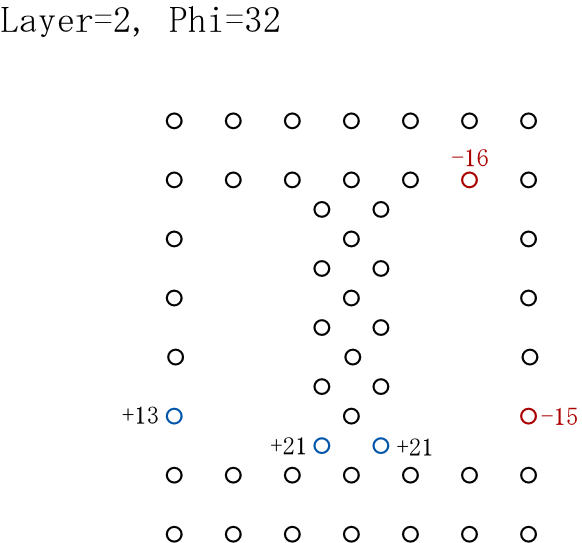
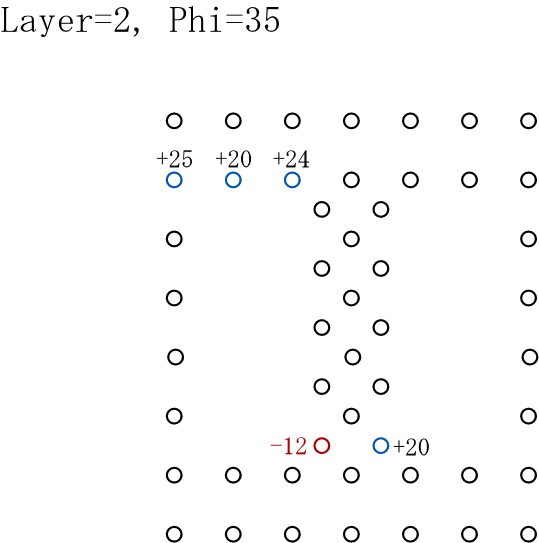
Following is a list of cells with low tension wires or no wire. Click cell numbers to display the wire layout and wires with problems.
Wires displayed with red open circles have tension less than 90% of average values, and red numbers indicate deviations from the average values; e.g., -13 means tension is 87% of the average. Blue open circles show wires with tensions more than 110% of the average.
Red filled circles show there are no wore at the positions due to wire repair. Gray filled circles with red "?!" marks tells the wire tensions were not measurable.